
Safe as Houses

I do not own a house but would like to. Herein I’ll be “talking my own book”, something worth remembering whenever reading any opinion piece.
Australian residential property has peaked. The bubble is bursting. The pain will cut wide and deep. The unbelievable returns from a non-productive asset class will, not surprisingly, prove an illusion. I’m talking proper millennial bearporn. Of course, I could be wrong (like every Australian property bear has been for the last 30 years) and I have been among their ranks for some time. However, I have never felt compelled to write a salacious doom piece with scary charts. That is because I draw a distinction between an overvalued market, and one primed for a fall. I believe the Australian residential property market finally ticks both boxes.
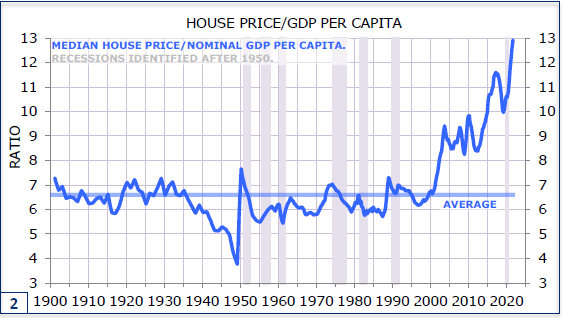
As noted above, over the years many have pointed out the imbalances in the Australian residential property market. The chart below tells me sometime around the year 2000, we collectviely lost the plot.
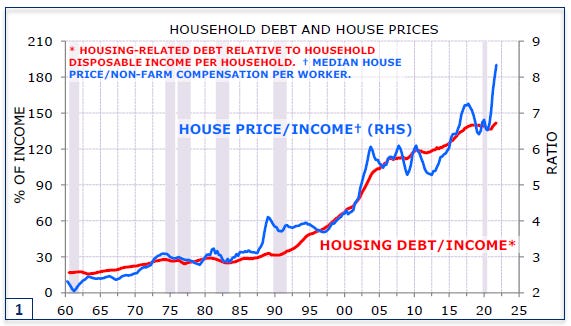
The accumulation of housing-related debt is staggering - from ~20% of income in 1960, to ~140% today.
The process at work here is quite understandable:
Young households take on mortgage debt to own a home and start a family, essentially secured (for them) by their future earnings.
This willingness to lever up puts upward pressure on prices; more money chasing limited stock.
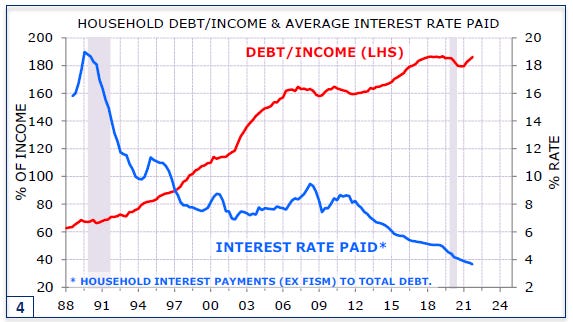
Rising prices would generally mean rising debt servicing costs (and attract construction), creating a natural limit, but not in an environment where rates have been declining steadily for 30 years.
Additionally, declining interest rates have ‘justified’ high prices (see below).
Rising prices invite speculation (I mean after all, can’t expect those boomers to keep their nest eggs in the bank earning 0%!).
Repeat.
No worries. Except, you may have noticed declining rates is a key feature of that process.
Anyway, who says 1.8x1 debt to disposable income is bad? Beware a lonely statistic I always say! We should compare with some peers.
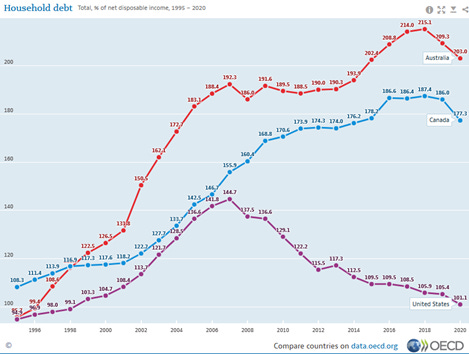
Note: some differences in RBA v OECD data, but its immaterial to the point.
You’ll note the 2007 US “housing bubble” is well and truly dwarfed by Australia and Canada based on this metric. However, as I’m sure the bulls among you are itching to point out, a high debt to disposable income is clearly no catalyst for a crash! Otherwise, we would’ve had one in the last 15 years. And I think that is correct. But perhaps you’ll agree it’s a dangerous precondition, akin to dry tinder on the forest floor.
To drive this point home, if we show real (that is, ‘inflation adjusted’) house prices v disposable income for a few countries, here it what you see. Spicy.
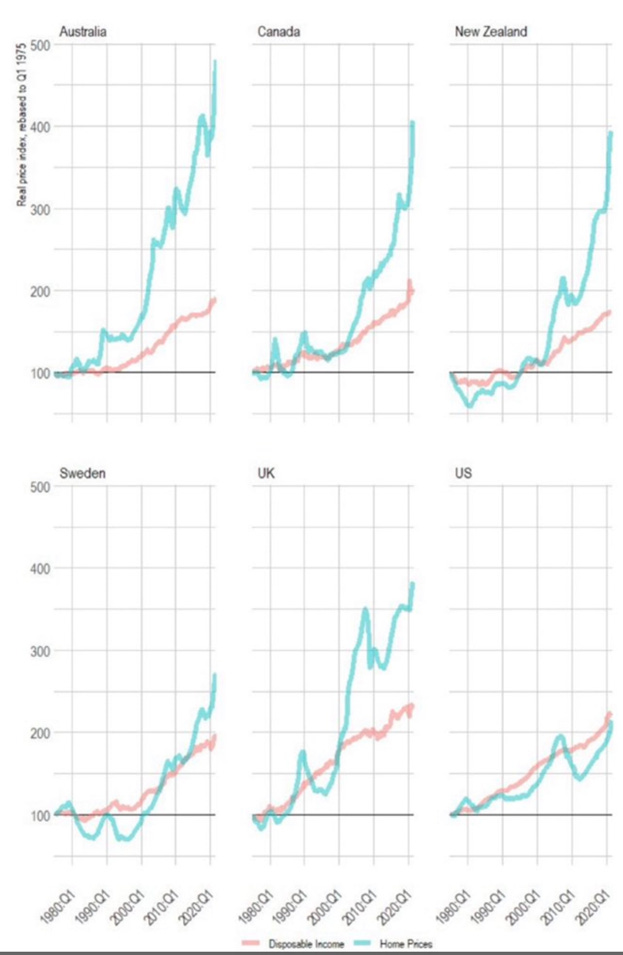
Are you convinced? I hope not, that would be too easy. We need moar.
Arson, Lightning, or Minsky? The three horsemen of the property apocalypse.
“Inflation” is back! And with a vengeance.
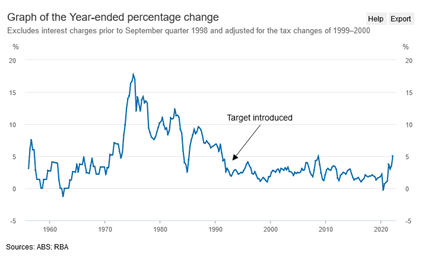
In March 2022, Australian inflation printed above 5%yoy for the first time since sept-2008 (an especially fun time from memory). This number was driven by broad price increases.

In my opinion, headline inflation will almost certainly continue higher in the near term:
Rent up 0.99%yoy is far too low, and rents are reasonably sticky. See another great chart from Alex Joiner below showing the lag in the official data.

May 21 AUD/USD was 77c, now 70c. ~9% decrease yoy has effectively increased the cost of imports. This may shock you, but we don’t make much stuff here anymore, so rising import costs hurt. Conversely, this is handy for exporters, but that’s little consolation for consumers in the short-term. As AUD falls, we import “inflation”.
Crude Oil was US$70/Barrel in May-21, now US$110, 57%yoy, largely thanks to Vlad and derelict western energy policies. Australia is a net importer of refined oil products, which are actually a key bottleneck and therefore increasing more than crude. Higher energy costs impact the cost of producing almost everything, not just what you pay at the pump. This will continue to flow into CPI while energy costs stay so elevated.
China’s insane zero-covid policy has dashed any hopes of the supply side of any supply chains returning to normal in the near term.
Therefore, I am left convinced we will print higher CPIs until something breaks, and even then, it’s no sure thing.
While the above can certainly change, without a catalyst the path we are on probably leads to higher inflation numbers than are politically acceptable, and from this I think we can glean some insight into the future.
Enter, the Arsonist: the Reserve Bank of Australia. I am not going to bash the RBA, that’s not in our scope today. They are the arsonist in this story because they do not have the tools to fix this problem, and yet politically, they are expected to extinguish the fire. Therefore, they will act by starting fire, to fight the inflation fire. Below are the market expectations; by the end of 2022, the market expects short dates rates to be ~3.00%.
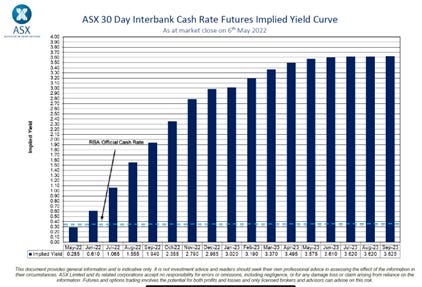
It’s been 10 years since the RBA target rate was at that level, and I would argue economic fundamentals have only deteriorated in the intervening years – increased debt, older demographics, and our largest trading partner (China) slowing abruptly. So, colour me sceptical if we get to 3% without the RBA turning a fire into a blaze.
The heat begins with rising rates, which means increased debt service (mortgage) costs and therefore tighter financial conditions. Left unchecked, this will likely lead to decreased credit creation and falling asset prices, then lower investment & consumption—which if not exquisitely tuned (read: “soft landing”)—leads to a recession and debt defaults. That scenario can quickly spiral out of control. I believe the RBA know this, but they have no choice but to try because they must do something. As noted, they don’t have the right tools for the job, all they can hope to achieve is to slow demand enough to relieve inflationary pressures. The RBA raising rates is not going to pump more oil out of the Middle East or get more ships through Chinese ports, but they can destroy domestic demand via reverse wealth effects (in theory you spend less when you feel poorer), and recession (you’ll spend less because you’ll be scared of the future). It does seem like performing surgery with a machete though.
To summarise: the RBA is going to start a recession fire in the hope they can keep it under control and that their fire will extinguish the inflation fire. Make sense? Na, not to me either. Even so, I would have much more confidence if there weren’t so many other exogenous factors working against them. The largest problem seems to be the gathering storm that is a global economic slowdown, which could produce a lightning strike, catching the RBA and their controlled burn by surprise.
Enough words, some charts.
It is my view the second half of 2022 will mark the beginning of a global recession, magnitude unknown.
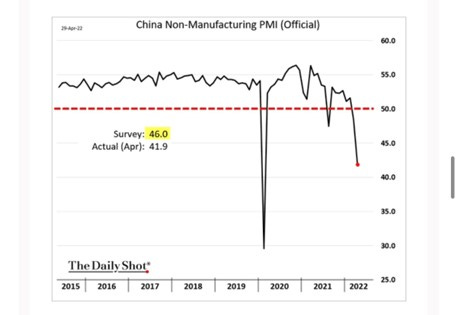
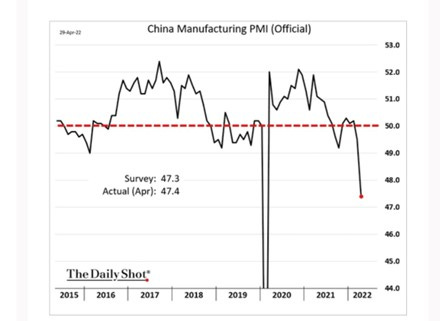
China, the world’s growth engine, has PMI’s slowing precipitously (a proxy for economic activity). This is to be expected with the extensive and ongoing covid disruptions, but a problem, nonetheless. Can they rebound like in 2020, or is demand the new problem?
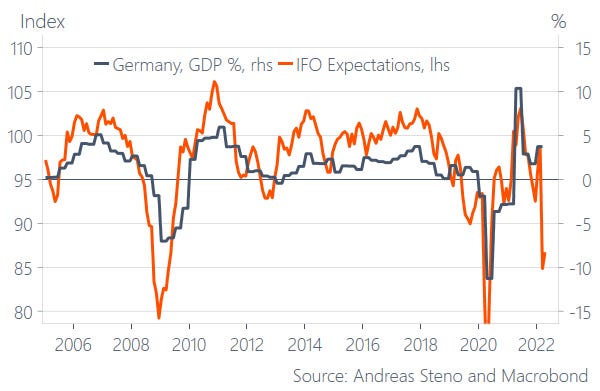
It’s not just China. Another major exporter, Germany, the bell weather for Europe is showing warning signs of recession.
Globally, ‘financial conditions’, a euphemism for financial markets getting rekt, have tightened rapidly, if consumer prices continue to rise, this almost certainly has to continue as central banks continue to “fight inflation”.
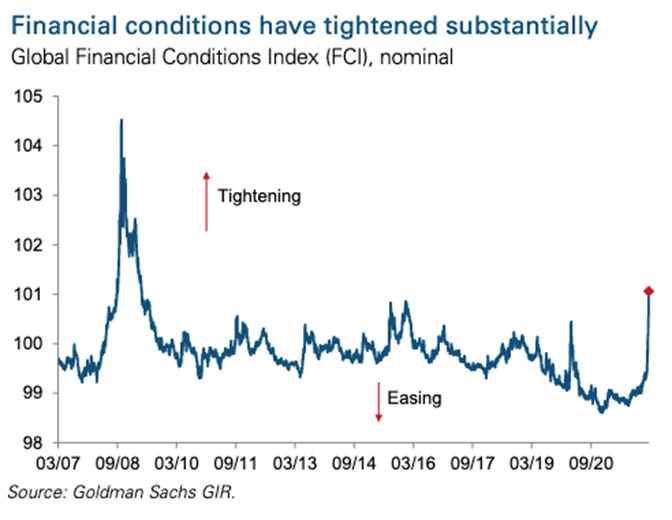
A global recession2 with an energy-led inflationary impulse could be the lightning strike for asset markets, including Australian property.
So far, the picture I’ve painted combines aggressively rising rates (as a political response to significant inflationary pressure) with a slowing global economy. The world has not seen an environment like this in decades. I expect all financial assets to have a tough time in this setup. However, the assets I expect to have the worst time are likely those which are fundamentally overvalued (e.g., crypto, meme stocks, and property markets with extreme debt to disposable income ratios which have recently experienced record inflows of capital).
Flows
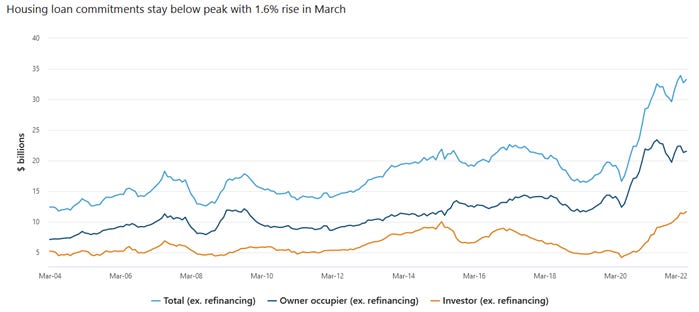
This chart from the ABS going back to 2004, shows the sheer magnitude of capital flowing into the Australia housing market. This is new loan commitments that measures flow, that is, new debt capital entering the market per month (a good chart to keep an eye on as a proverbial canary). I interpret this as a full-blown FOMO mania. At the start of covid there was a feeling that this was it, this was the moment all those non-property owners had been waiting for, “finally a correction!”, but then: “to the moon.”
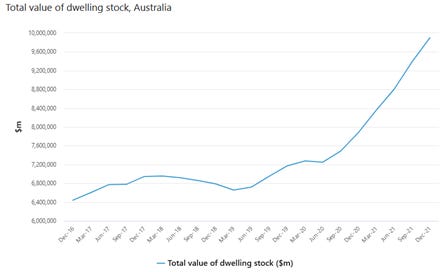
The chart below shows total housing stock in Australia is valued at $10 trillion. Up $3 trillion since the pandemic started. Now at 5x GDP! As Tarric Brooker wonderfully points out, the US housing market plus 2x the total US equity market equals ~5x US GDP. Whoops.
This next chart shows lots of first home buyers piling in, but they generally seem to be exhausting themselves. Another chart to watch as a leading indicator.

What happens when a mania runs out of buyers? This is usually the problem with credit driven manias; once you run out of new money, the pyramid tends to collapse under its own weight. An economist named Hyman Minsky is famous for something called the ‘financial instability-hypothesis’. I won’t bore you with the details, but adapted for the Australian property market, we have something like this:
Hedge Finance – Those who can pay both the interest and principal portions of new credit from existing cashflows with comfortable headroom in their debt servicing ratio, and even manage during a recession.
Speculative Finance - Those who are able to pay the interest but require the ability to refinance or “roll” the debt, or who can pay the principal with an uncomfortable portion of their cash flows. They are likely to come unstuck during a recession as their cash flows decrease and asset prices fall.
Ponzi Finance – Those who rely on increasing asset values to service their debts. They are of lower credit quality who should probably never have been given a loan with 10% down at 10x price-to-income. They are forced sellers in a recession.
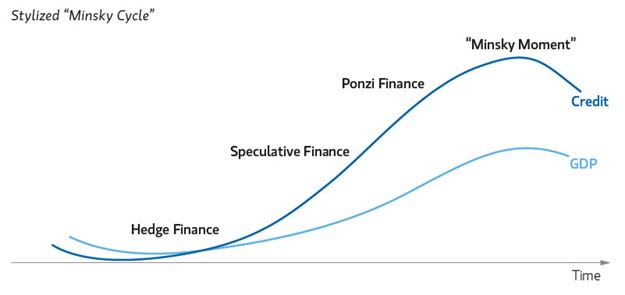
At some point the “Minsky moment” is reached where some combination of a lack of buyers, external shock, change in sentiment, or regulatory change sets the forest alight. I’ll refrain from speculating on how many would come unstuck with falling prices or incomes, but hopefully the data previously presented shows just how far we have strayed from anything resembling reasonable.
So, for the question of Arson, Lightning, or Minsky? My answer is: all of the above.
Therefore, I believe this time is different (for bears). This combination of an extremely overvalued property market, exhausted after huge flows caused a blow-off top, combined with a budding global stagflation event as rates rise, will likely reveal Australian property to be a future case study in the madness of crowds (and governments).
I have laid out the situation as it is, and my case for a crash. This piece is already longer than anticipated. It is worth covering, home equity withdrawals, bank funding and solvency, potential draw-down timing and depth, and of course policy response. Because I am sure as many of you are thinking, “They” won’t let something like this happen. And I agree They will try. But They will fail. More to come.
Not financial advice.
For clarity. “Housing debt” is currently 140% of income. This is distinct from “household debt” which includes other personal debts. RBA calculations of household debt is at ~180% of income, and OECD calcualtions are at 203% of income.
For the sake of brevity, I have kept my rationale short on the global economy in this piece. I intend to flesh this out in a separate piece for those interested/unconvinced.