

Macro Note (May 2023)
That's it, I've seen enough.

Summary
Globally synchronized recession looks baked into the cake. Timing is uncertain, but may have already started as early as the beginning of the year. Risk assets look mighty dangerous from here.
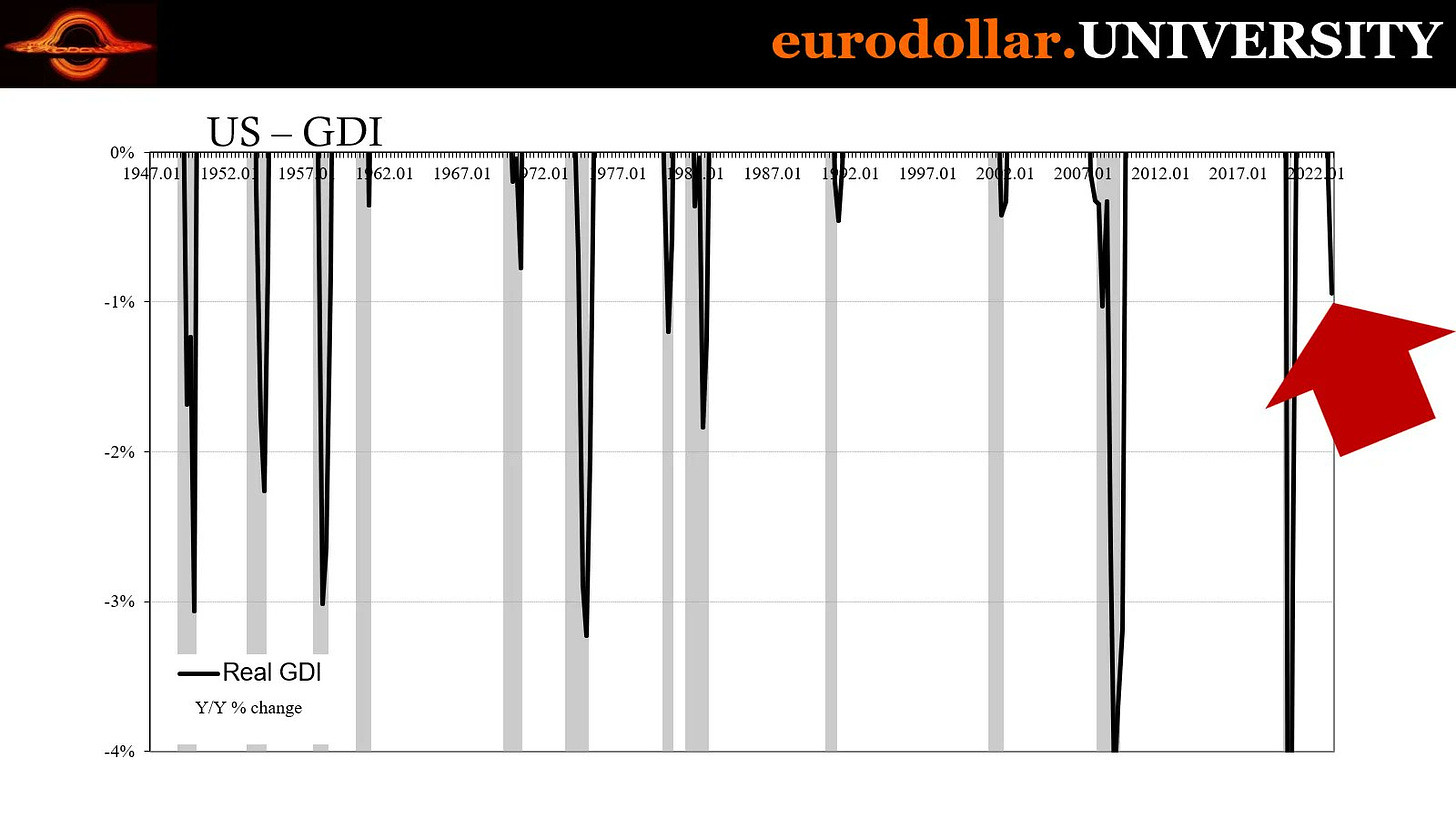
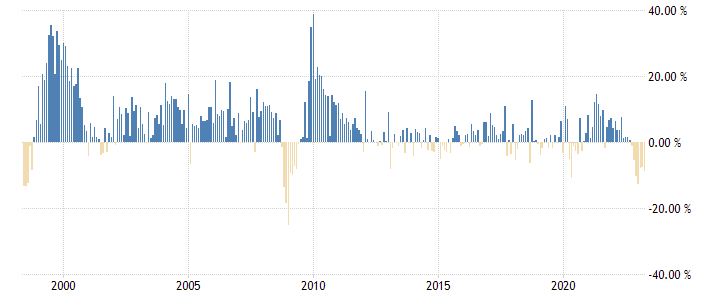
GDP and GDI are two sides of the same coin but can differ in estimates depending on a cycle’s idiosyncrasies. They will be revised (to be more inline), but in the last 75 years, US GDI has never drawn down this much without the US in recession.1
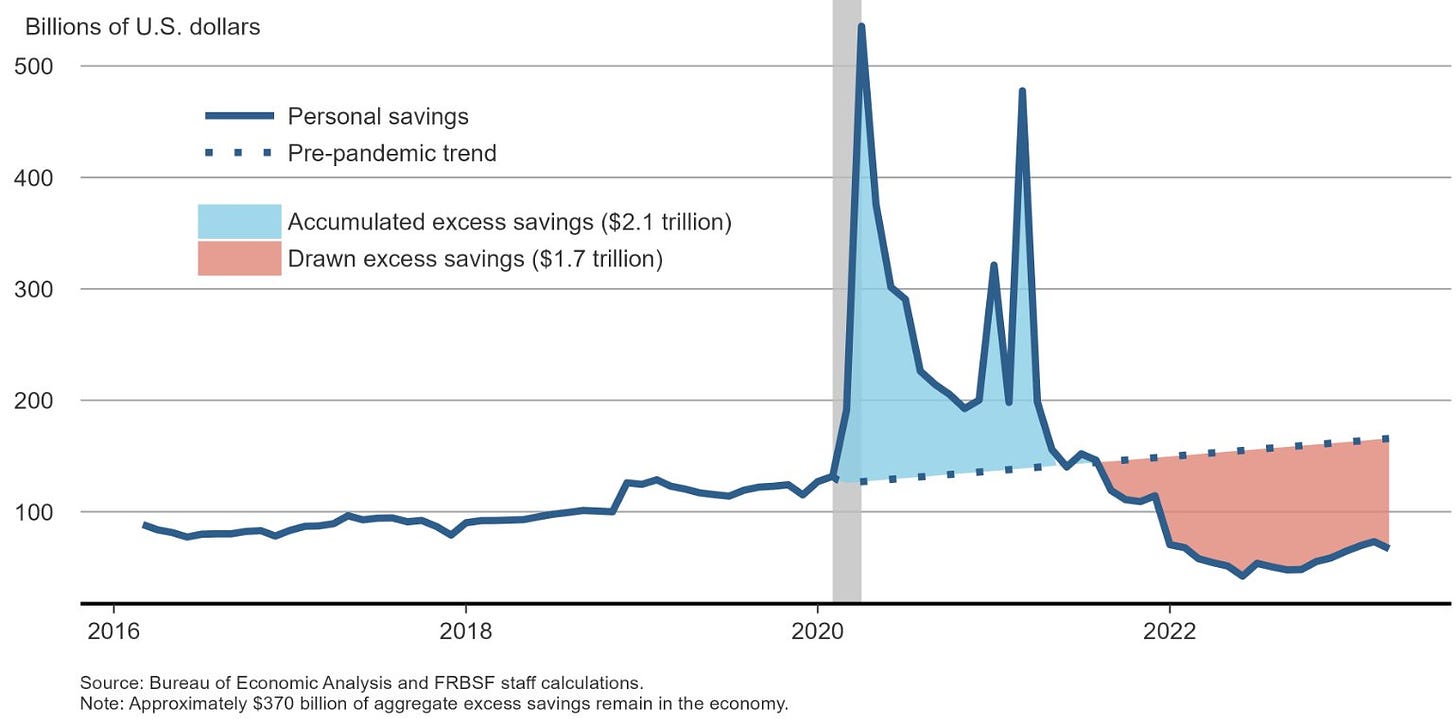
As noted in the last couple of notes, US Consumer “excess savings” and China reopening have been the two big unknowns in terms of economic momentum, but these seem resolved.
Excess savings appear to be getting closer to exhaustion, and with student loan repayments restarting (yes, they have been suspended this whole time) around July-Sept, consumers will likely pull back further.
China reopening has largely been weak. Domestic demand seems subdued, likely due to the ongoing real estate crisis, and manufacturing for exports seem to be pushing on a string (likely the bullwhip effect2 part of the inventory cycle). Will probably pick up, but who will be the customer?
After the few positive prints of econ data (particularly Jan), things have decidedly turned downwards, and increasingly large revisions to prior months is a tell-tale sign of the fog-of-cycles3
Some economically sensitive commodities, namely iron ore, copper, and oil are all failing to catch a bid. Particularly in copper, and oil, given the tightness in inventory levels, markets seem to be pricing in a whole lot of demand weakness. Could be explosive if markets are wrong, but scary for different reasons if they are right.
While no indicators are infallible, when so many are flashing red, you have to admit - when it walks like a duck, sounds like a duck, and looks like a duck, its probably a material economic downturn.


US Economy
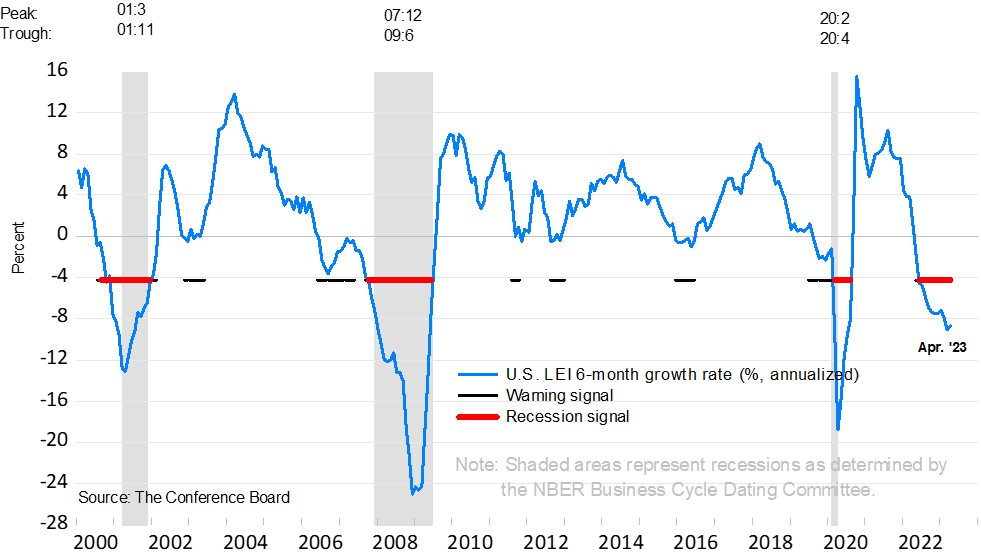
Conference Board
The Conference Board’s4 Leading Economic Index (LEI) attempts to measure the “duration, depth, and diffusion” in economic downtrends to forecast recessions. The chart below is quite self-explanatory.

Rates
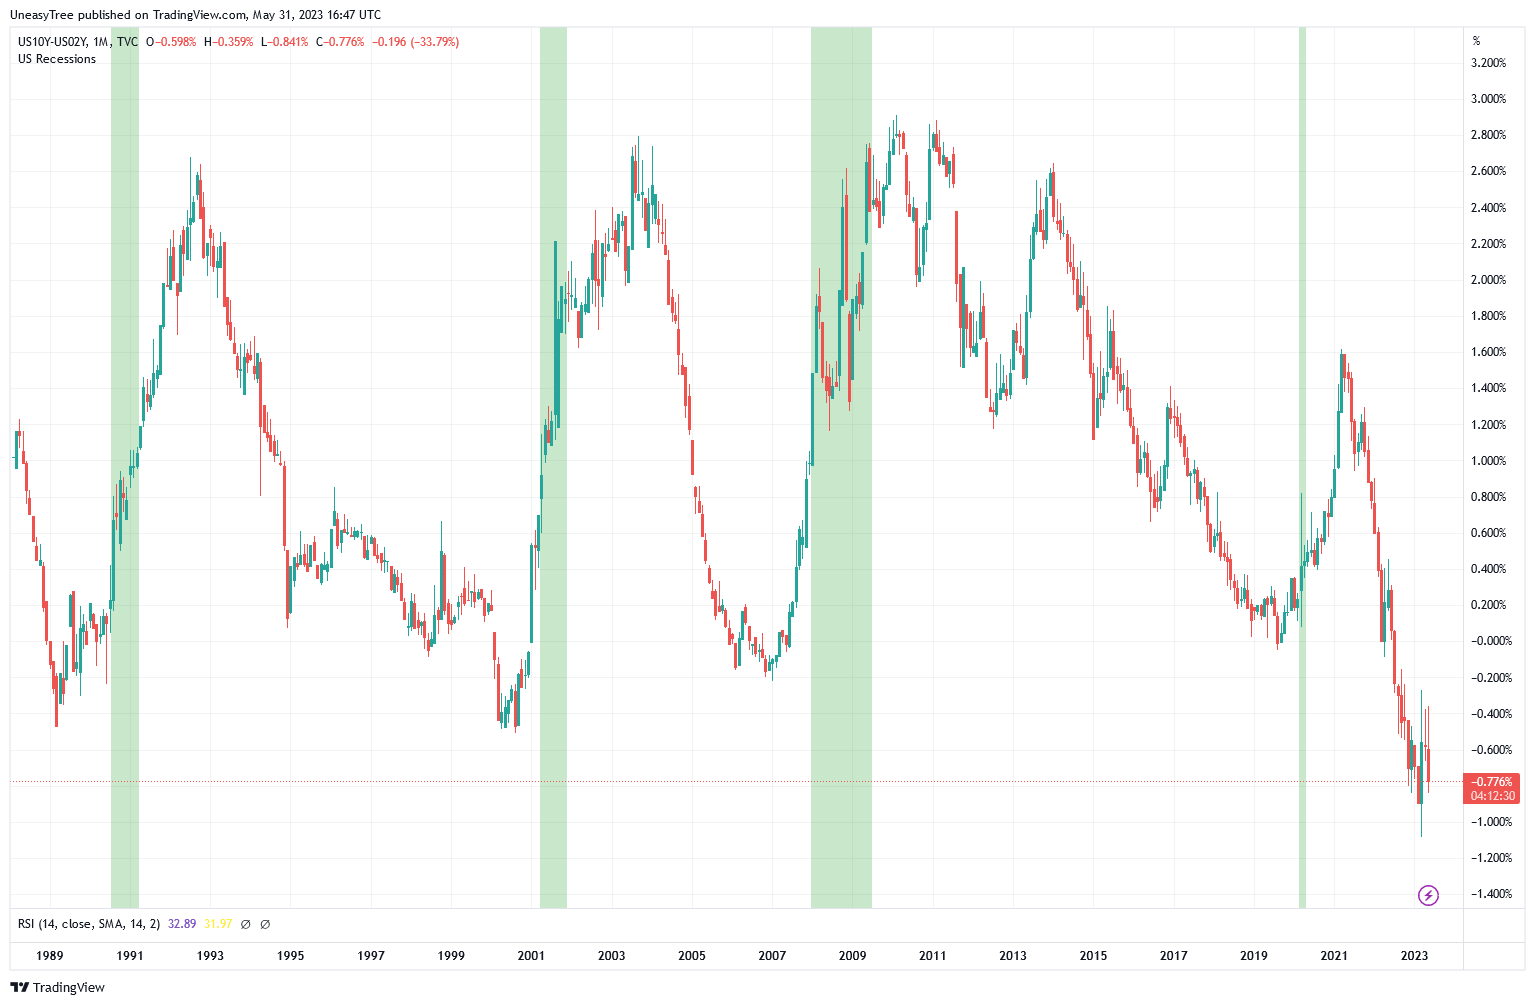
Near term forward spread5, JPow’s own favourite yield curve indicator that has “The near-term forward spread had substantial predictive power…for the chances of recession” is the most inverted since 1981. He seems to have forgotten he believes this since saying it in March 2022.6
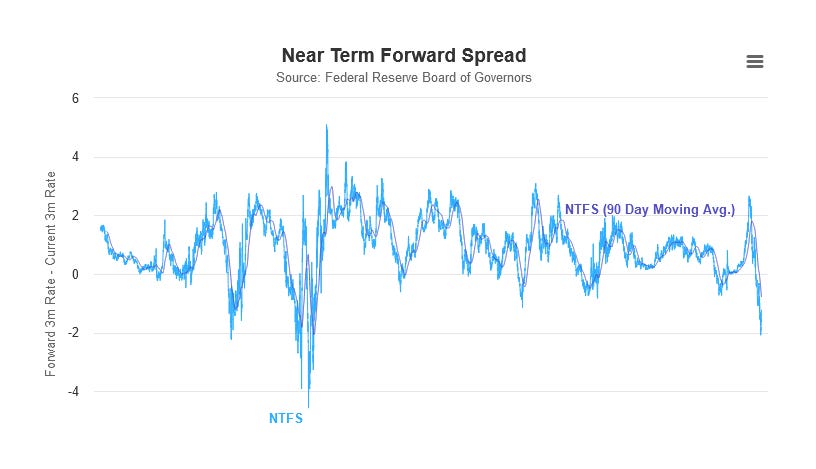
It is also worth noting this chart goes back to the start of the 60’s.
However an obvious (reliable) recession indicator, a rapid “bad” steepening7 of the yield curve hasn’t happened yet.
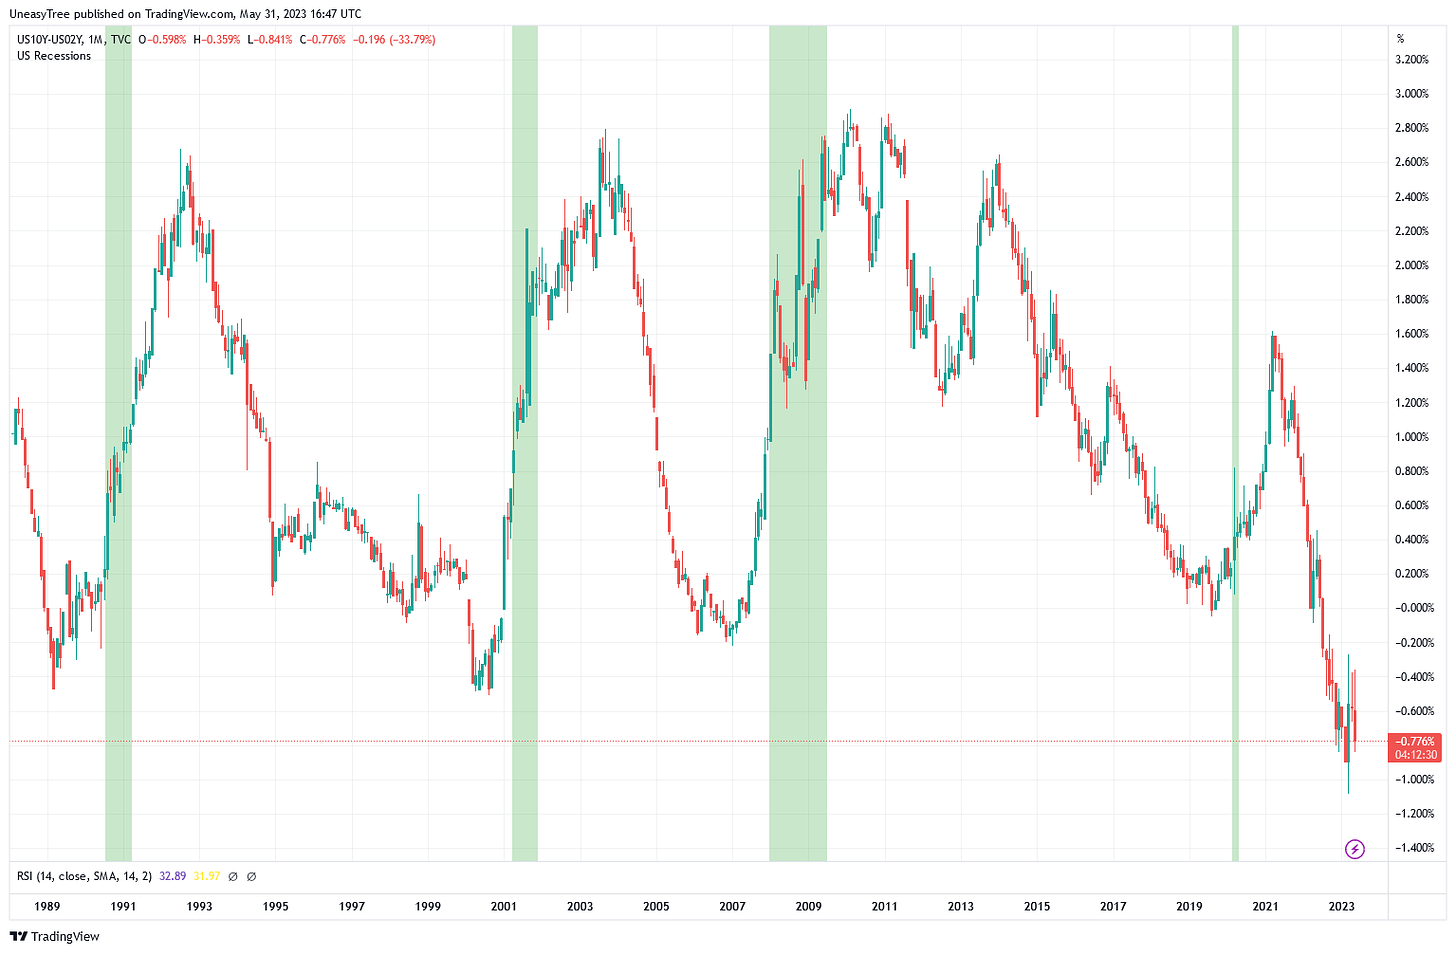
I believe this is because the Fed still has a tightening bias due to the stickiness of inflation (and fear of it becoming “unanchored”/”entrenched”, perceived tightness in the labour market, and the monkeys keep bidding stocks! Therefore, as usual, the Fed was be late to the party and now will be last to know when the cops arrive to shut it down.
The Fed will likely do +25bps in June and its quite mental to think that they are still tightening into a rapidly slowing economy.
Banking Crisis
While things have calmed down for now, it is unlikely it was all just a bad dream. Regional banks are still chock full of commercial real estate with imaginary marks, but this is starting to unravel as a few sellers are forced to cross the spread to off-load problem assets.
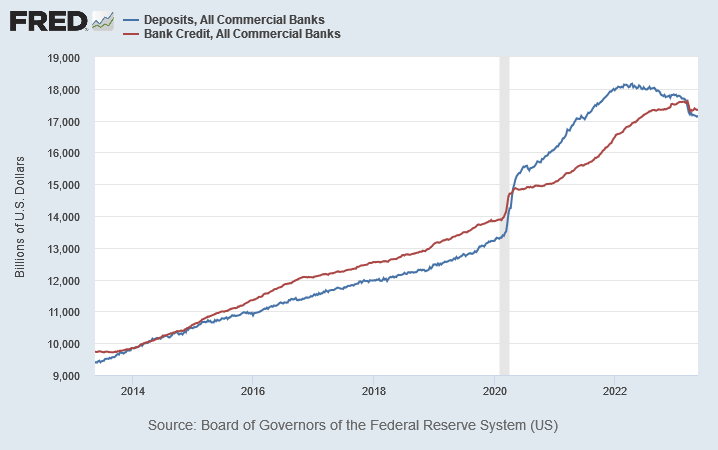
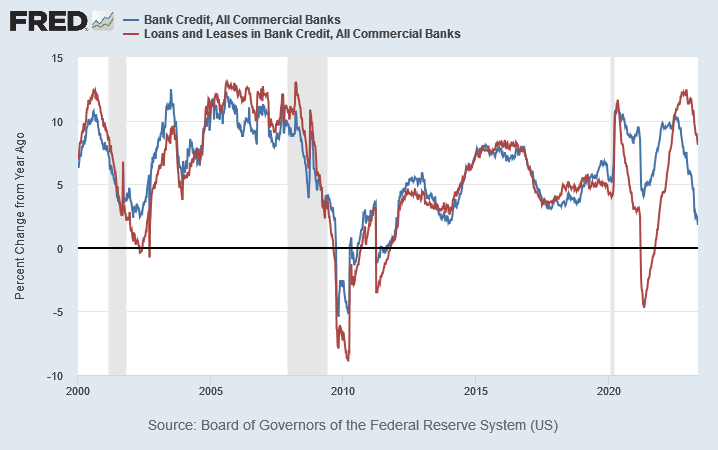
Bank credit growth falling precipitously.

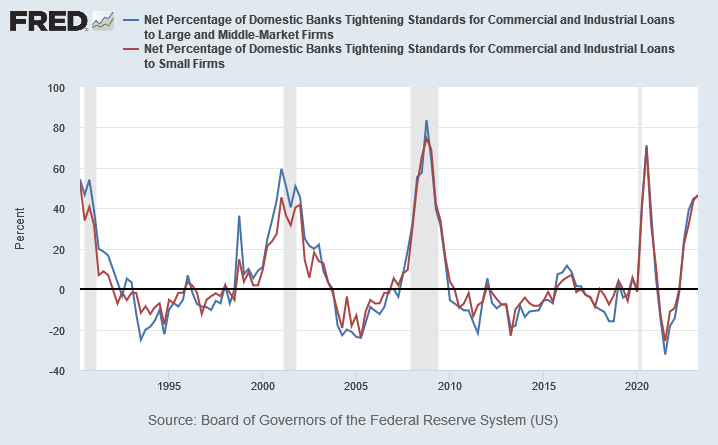
Bank lending standards continue to tighten, albeit at a slower pace.
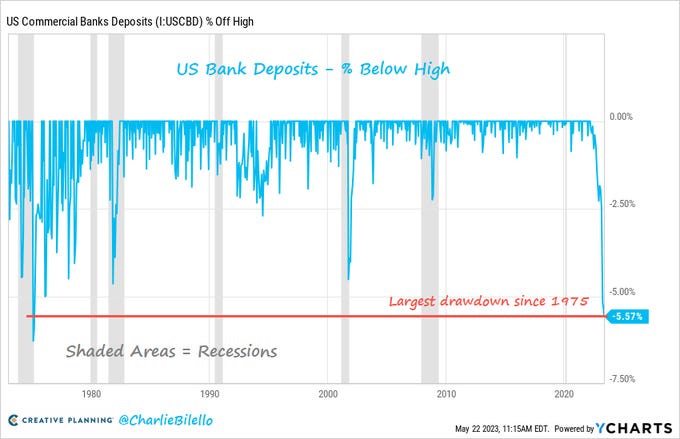
Finally, bank deposits continue to draw down as people seek yield and protection in money-market funds (data to mid-May 2023)

While you may be thinking, but monsieur Tree, bank credit and deposits are both still up so much, why are you worried about such a little decline! Well astute reader, great question, more on this in the special section next month.
Employment
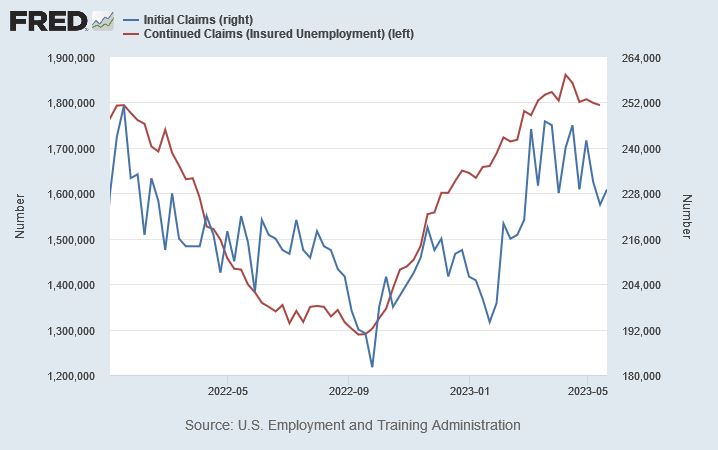
Unemployment claims have started to move higher, but haven’t really taken off. This is expected, given employment is a lagging indicator (firing people you’ve spent money on hiring and training is expensive, one needs to be sure)
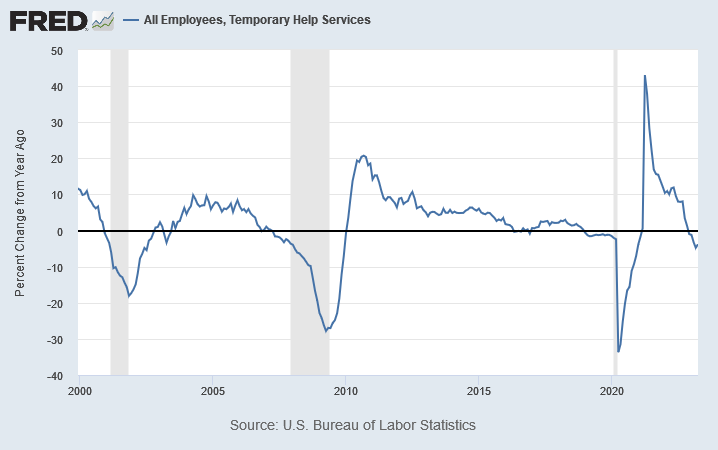
However, the more leading components of employment are quite clear.


China
Markets expectations of a huge surge in economic activity out of China have been disappointed. While it has still not been that long (re-opening was Nov-Dec, everyone was sick Jan-Feb), its clear there will be no consumer led surge like in the rest of the world post reopening. Probably due to 1) China has never been a consumer led economy (one of their structural problems going forward) and 2) real estate is a secular religion in China, and it hasn’t been going well.
While its impossible to get a good read on the CCP’s intentions (because they are lying lairs who lie), it seems clear that, as stated, they will not go back to the old playbook of stimulus for construction. They are still still pushing supply-side policies to juice industrial production/exports, but it will be interested to see how much the RoW can absorb if they are in a recession.
All I know is the Yuan is volatile and weakening again, and that is never a good sign for anyone.
Oil
OPEC cut production and (Brent) Crude got to $88, but is now trading at $72.
The physical supply and demand balance is reasonably tight, but the market seems to be sure demand will be weak.
There is a strong longer term bull thesis for oil (structural under investment), but need to see how the near term plays out to develop an entry.
Ironically, oil moving lower ahead of a recession is likely delaying a recession as it takes pressure off consumers. Lower oil = Tax cut. (But remember, the Saudi’s want their taxes)
RoW
Despite the dollar taking a breather over the last few months, much of the world is limping along at best.
UK is battling stubbornly high inflation and rapidly slowing growth.
Germany (my EU bellwether) has posted 2 consecutive negative quarters of real GDP growth. And the EU as a whole decelerated to 1.3% yoy for Q1 based on current estimates.
South Korean industrial production (my Asia bellwether) is starting to look like 2008 (below)

It seems difficult to find a bright spot in RoW at present (perhaps India), and if the USD dollar does indeed start a wreckin’, as I expect it will, things will likely deteriorate rapidly from here.
Markets
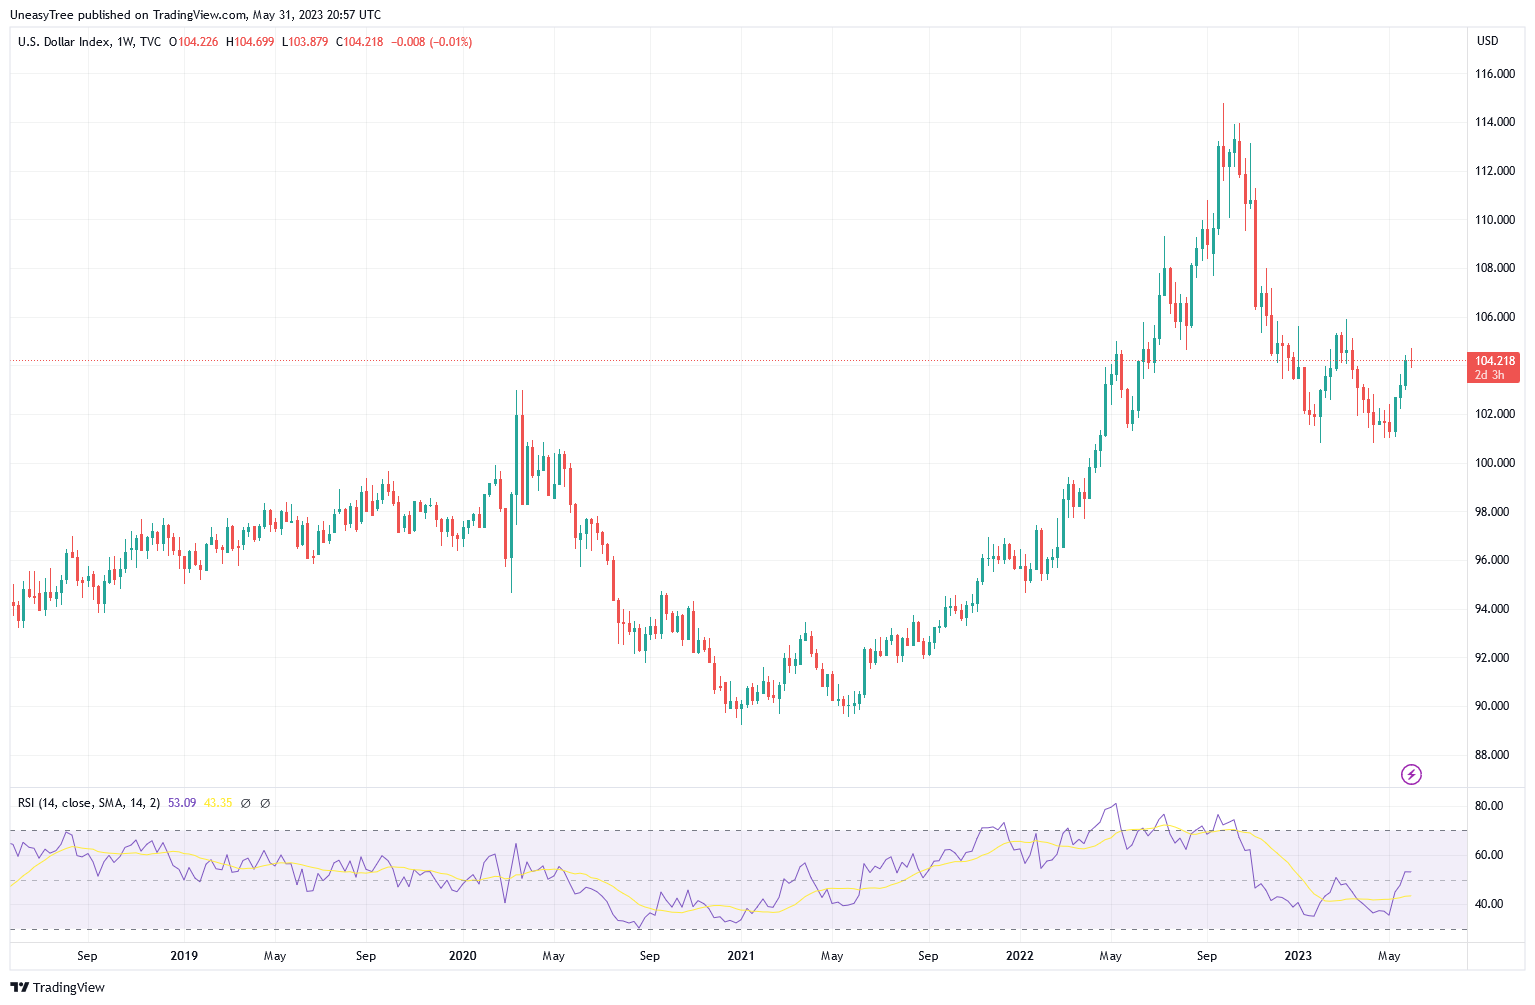
USD Wrecking Ball
She’s back.
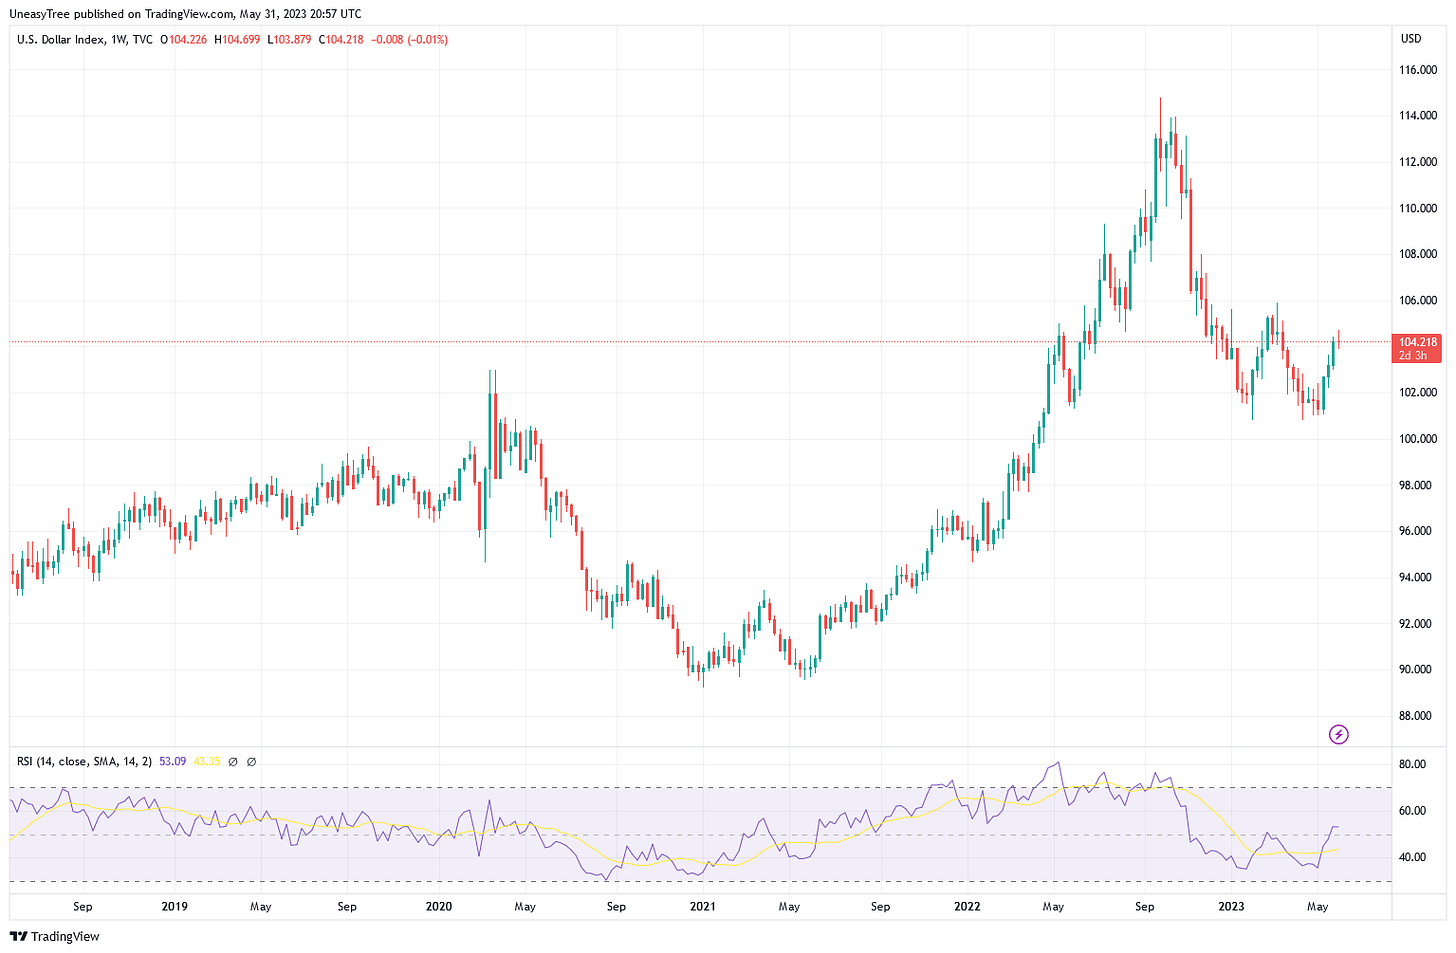
Ok, perhaps that is a bit premature, however, it certainly does seem like the dollar has found it feet and is beginning another leg higher. One to watch, if the dollar takes off here, take cover.
Equities
Breadth is terrible but mega-caps and AI are holding everything together.
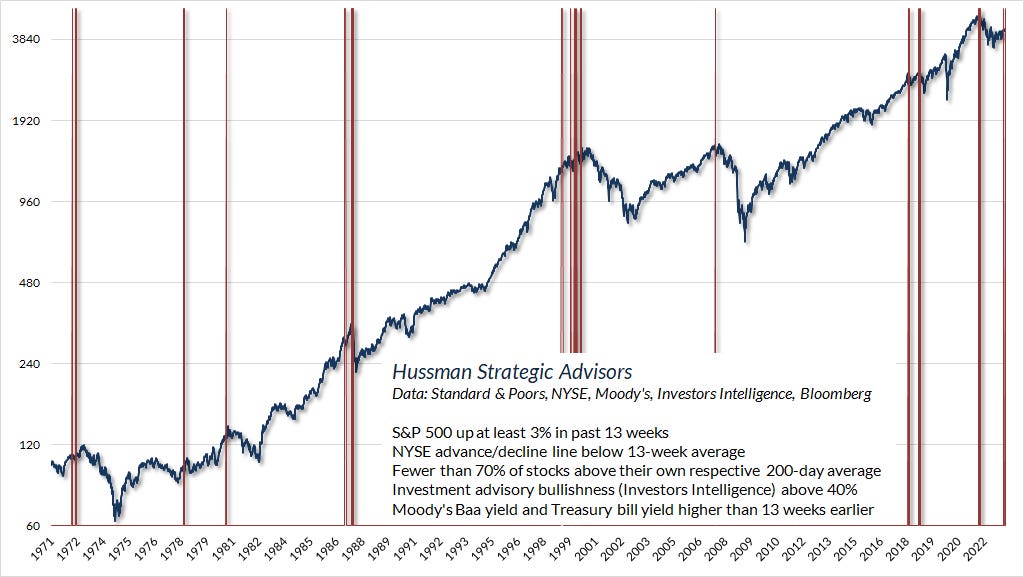
Just look at the difference in recent performance in NQ, SPX, and RTY. As John Hussman often says, in bull markets speculation is “indiscriminate” and therefore breadth is wide,8 these ragged divergences are not indicative of a healthy “bull”. Incidentally, he just posted this fantastic chart.

US equities seem to be playing the old game. Where any weakness was in markets garnered a rapid reaction from the Fed to keep asset prices high. However, that was the game sans inflation. Now the Fed’s reaction function is changed. It can no longer be so one dimensional. Which makes me think being long equities here is quite the risk.
We are entering the low liquidity summer period, which is more accident prone. This little AI driven blow off top could be the bell.
Positioning
(New this month is a short abbreviated summary on positioning, for my own records)
Long 2Y Futs - yields should collapse with fed funds expectations in a recession.
Long SOFR Calls - deep OTM 2023-24, convex in v hard landing
Gold straddle (Put bias) - hedge long term miner & physical + convex in liquidation event where gold is sold.
Short ES Futs - for slow bleed lower (e.g. 2022 no vol theta bleed)
Long ES Puts - deep OTM various tenors focused on rest of 2023 (vol play)
Long Tech Puts - as above + TSLA (biggest), NVDA, AAPL, GOOGL
Long O&G (&Coal) equities - accumulating for long term and as hedge on moar fiscal (and therefore inflation ripping)
Short AUD/USD via Puts (also small positions short Cable, EUR, & JPY)
Long USD Cash (short AUD FX)
From the invaluable Jeff Snider - https://linktr.ee/eurodollaruniversity
https://www.investopedia.com/bullwhip-effect-definition-5499228

https://www.conference-board.org/topics/us-leading-indicators
“The near term forward spread is the difference between the expected 3-month interest rate 18-months from now minus the current 3-month yield. The near term forward spread is a good indicator of the future stance of monetary policy as well as recessions.” -
https://www.neartermforwardspread.com/
https://www.federalreserve.gov/newsevents/speech/powell20220321a.htm
"Bad” steepening, in when the yield curve un-inverts due to short tenor rates (<~2 year yield) falls faster than the longer end of the curve (>~10 year yields). The whole curve is shifting downwards, but the shape is changing due to the difference in rate of change. This generally happens because the expected path of policy rates (e.g. fed funds rate) is falling rapidly dragging down the short end. This is usually due to them hiking until something breaks (sound familiar?). Policy rates have limited impact on the long end of the yield curve as these are driven by longer term inflation and growth expectations.
That is to say, everything goes up. The rising tide lifts all boats.